About Privado
Privado is a privacy engineering platform. You point it at a repository and it follows every piece of personal data through the code, from the line that first collects it to the point it leaves your system. The people who use it don’t normally sit together. On one side are privacy and compliance teams who answer for the regulatory risk. On the other are the engineers whose code actually moves the data.
Product
For years privacy compliance lived in spreadsheets and legal documents, which to most engineers is a foreign language and part of why they treat it as a chore. Privado swaps the questionnaire for the codebase. It scans the repo, maps where each piece of data ends up (shared to a vendor, saved to a database, quietly written to a log) and turns every finding into something an engineer can fix. The tricky design problem is scale. One variable can travel through dozens of files before it leaks, and the same screen has to work for a compliance lead and a developer at once.
The problem
Underneath all of it was one gap. Compliance and engineering were solving the same problem in two different languages, and it showed up three ways:
Compliance needed to see where data went and how it was used. Engineers needed a file and a line number, and neither view existed in a form the other could read.
Nobody had a live picture either, so sensitive fields kept slipping into logs and out to vendors, and teams found out long after the fact.
And when something got flagged it was abstract. You heard it was wrong, but not where it lived or what to do about it.
Research and the two users
I spent the first stretch of the project with both sides of that gap, sitting with privacy managers and engineers of different seniority and mapping how each one spends a day. Two people kept surfacing:
Dana, a compliance manager, thinks in oversight and reporting: how healthy is this codebase, what do I hand the auditors. She has no interest in reading code.
Eli, a lead engineer, thinks in execution: which file, which line, what do I change. He tunes out anything that feels like paperwork.
Nearly every choice after this came down to one question: how do you serve both of them from one screen without watering it down for either.
Information architecture
The hardest layout problem was the data flow view. It had to give Dana a high-level read and Eli hard evidence on the same screen, so I built it to start wide and narrow to the exact problem.
The top is for glancing. Four numbers (data elements, sensitive usage, third parties, open issues) tell Dana how a repo is doing in seconds. Below that a map links each type of data to where it lands, so a finding reads like a sentence: payment details are ending up in console logs. At the bottom sit the receipts, the instance counts and log types that make an engineer believe the scan.
The dashboard uses the same shape, reporting up top and the issue list below, with a sidebar so each of them stays on their own side.
How I approached it
A handful of ideas ran through everything.
First, the code is the source of truth, not a form somebody fills in once a quarter, so Privado can point at the actual line where a name gets logged instead of trusting people to self-report.
Second, out of testing: Dana wanted the story first and the proof second, while Eli wanted it the other way round with evidence a click away. Rather than pick a side, every screen leads with a plain summary and keeps the forensic detail one layer down. That order runs through the whole product.
Third, trust. These are people’s private repos, so the interface says out loud, more than once, that analysis runs locally and the code never leaves their machine.
Sign up & Log in
Sign up is where a security-minded buyer gets nervous, so the screen leans hard on reassurance. GitHub is the natural way in for a developer, but the promise that Privado will not touch your account without asking sits right beside the button, not in a footer. The left panel carries the pitch and a real quote from a compliance manager who found flows her audits had missed for two years, which earns a click better than any feature list. Email is there too, for the compliance people who will never connect a repo but still need to get in and invite the team.
Sign Up


Onboarding
Most tools make you connect a repo before you see anything useful. I flipped that. Onboarding is a short walkthrough on sample data that takes someone from “what is this” to “oh, that is my data” before they commit to anything.
Guided Onbaording
The moment it lands is step two, where one field, customer.email, fans out to the four places it really goes: off to Segment, into Postgres, quietly out to an external endpoint. Then it shows a finding opening a Jira ticket on its own, so the payoff is obvious. Only at the end does it ask you to connect, with a few doors to pick from: a full CI/CD setup, a quick GitHub connect or a CLI so a non-developer can start a scan and pull in the team.

First run
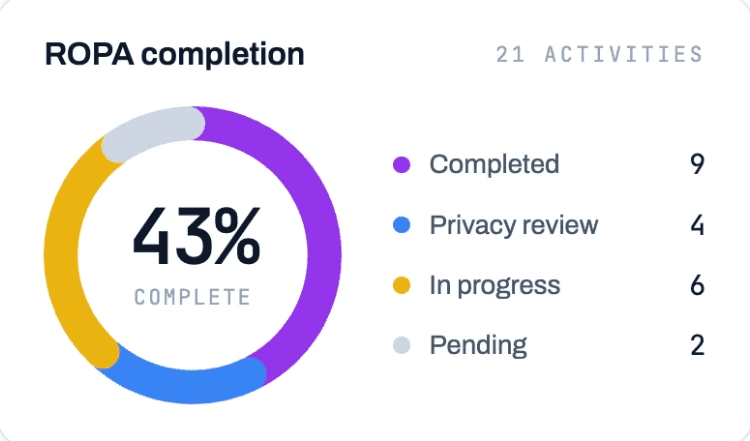
The dashboard is home for both Dana and Eli, so it is split by altitude. Up top is the reporting she cares about: ROPA completion, thirty-day trends, the counts of sensitive data and third parties. Below is the working layer he lives in, a live list of which repos are scanning and which issues just landed. The three states matter as much as the split.
First run Dashboard
Before a scan it runs on sample data, so a cautious buyer can explore without connecting anything. During the first scan a banner shows how far along it is and surfaces findings as they appear. Once it finishes the numbers keep updating as the code changes, which is the point: this is not a one-off audit, it is a live view.

Issues: triage and filters
With 412 open issues a flat list is useless, so this is really a workspace you bend to whatever you are doing. Clearing the scary items before a release, you group by risk and take out a whole tier at once. Wondering what you just broke after a merge, you group by time. Hunting the one leaky service, you stack filters until you are looking at medium-risk issues in payments and nothing else. I also put real effort into the unglamorous part, keeping noise down: you can ignore a false positive or mark something fixed without deleting the finding, and that syncs to Jira and Slack so nobody works off a stale list. A queue people trust matters as much as one that is complete.
Issues List
Issue detail and
deep-dive
This is the screen that closes the gap between “something is wrong” and “here is the line.” It opens with a plain sentence about the leak, then gives you two ways to dig in. The Data flow tab is the picture: personal data on the left, the path through the code in the middle, where it lands on the right. The detail I pushed hardest for is that it marks the root cause, enrichOrder(), not just the leak, so you fix the source once instead of patching every place it surfaces. The Code analysis tab is the proof, a breadcrumb grouped by file that drops you on the offending line with the rest folded away. The fix stays in view while you read the leak, tied to a real standard like CWE-532 so it reads as engineering advice and not a compliance memo, with an Open PR button a click off.
Issue Detail
The detail I pushed hardest for is that it marks the root cause, enrichOrder(), not just the leak, so you fix the source once instead of patching every place it surfaces. The Code analysis tab is the proof, a breadcrumb grouped by file that drops you on the offending line with the rest folded away. The fix stays in view while you read the leak, tied to a real standard like CWE-532 so it reads as engineering advice and not a compliance memo, with an Open PR button a click off.

Design system
Near the end I built out the design system with the team: colour, type, the components for data flows and code diffs, the risk and status indicators and the rules for how a constantly updating, live-scanning interface should behave so it stays calm rather than frantic.
Impact
The result I am proudest of is a quiet one. Dana and Eli finally look at the same screen and see the same problem. She can pull a ROPA report straight from the scan he is using to chase a log leak, with nothing lost in translation and none of the multi-year blind spots the old process left behind.